This manual was designed to provide hands on instruction to the user. Proceeding through the manual, users will learn how to navigate the dashboard, utilize the tools provided, and ultimately determine the exposure of your portfolio. (place holder text)
While the RZAlert Dashboard is primarily designed to enable the user to visualize their portfolio exposure in relation to natural disasters. The dashboard has also added functionality to support communication with, colleagues, the boardroom, and even the policyholders themselves. This manual will demonstrate how to leverage this functionality.
Users are encouraged to take advantage of the videos that are embedded throughout the manual.
Navigating the Dashboard

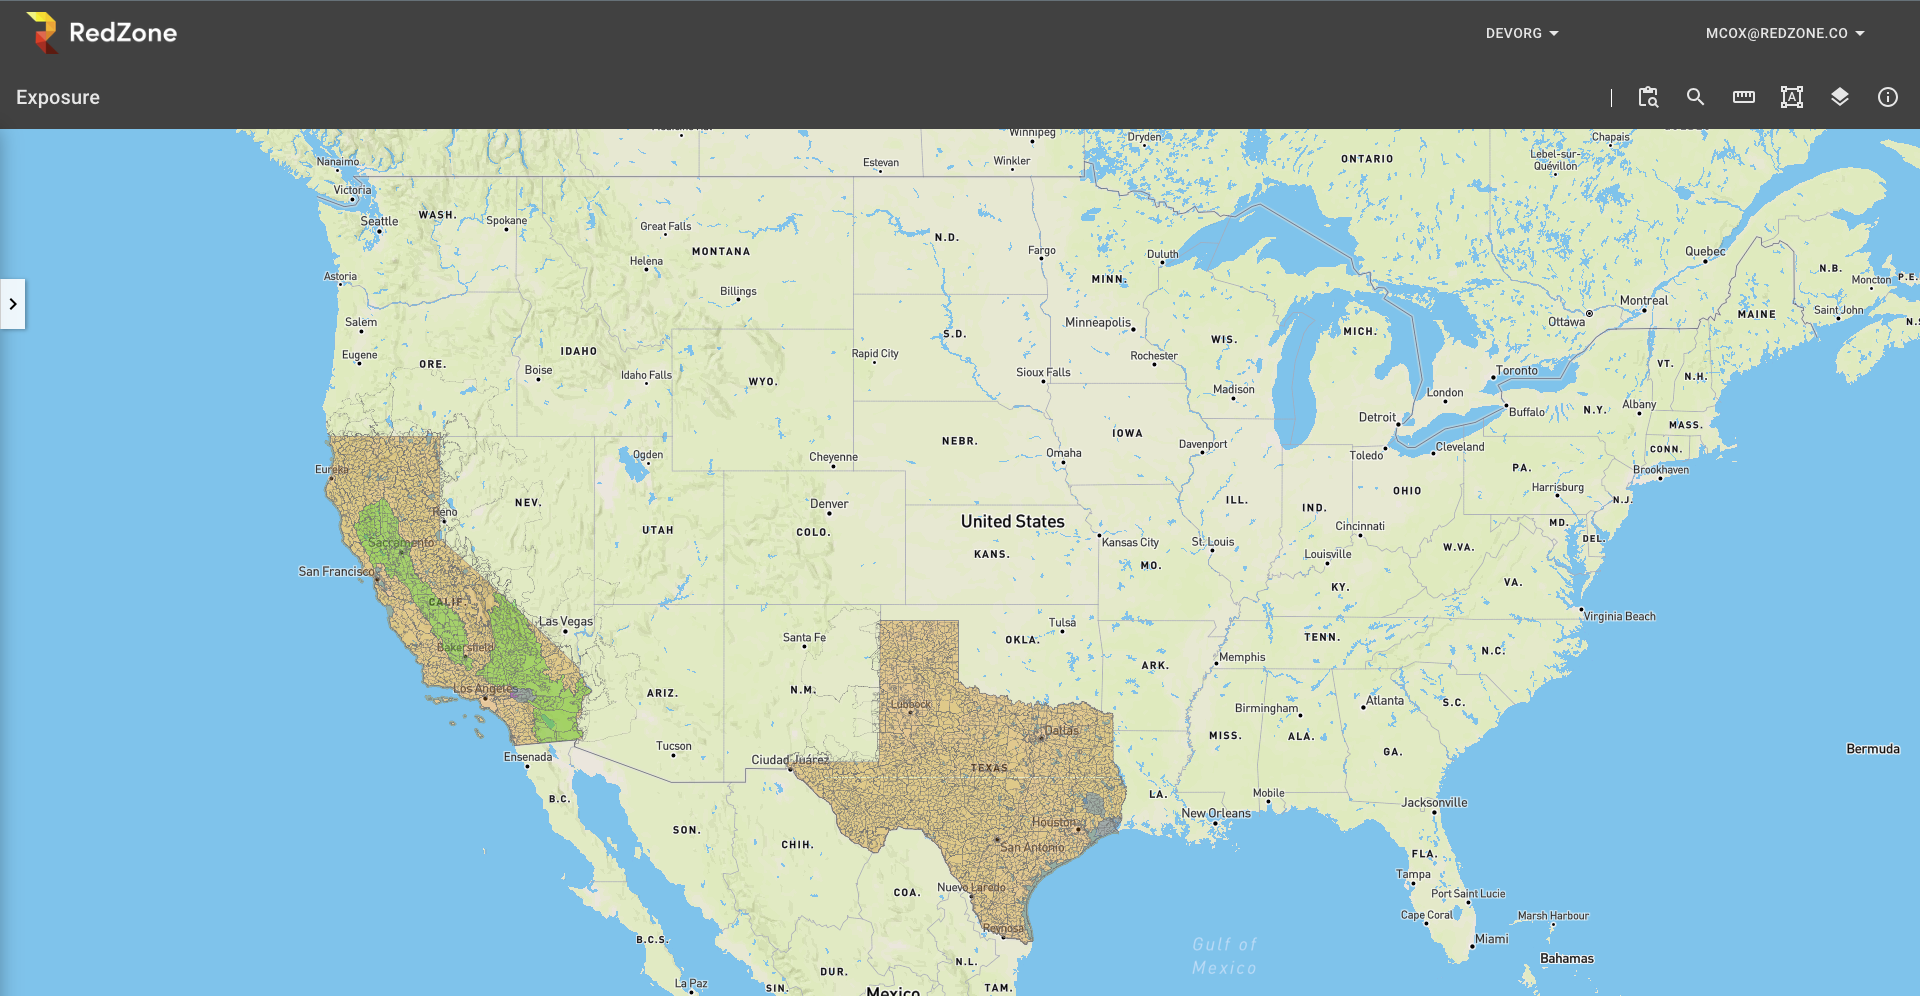
Within the RZExposure Dashboard the map in the center allows the user to pan around, zoom in and out to analyze … The top-right corner of the browser is where the map tools and map layers exist.
Dashboard Tools

Within the RZExposure Dashboard the map in the center allows the user to pan around, zoom in and out to analyze … The top-right corner of the browser is where the map tools and map layers exist.
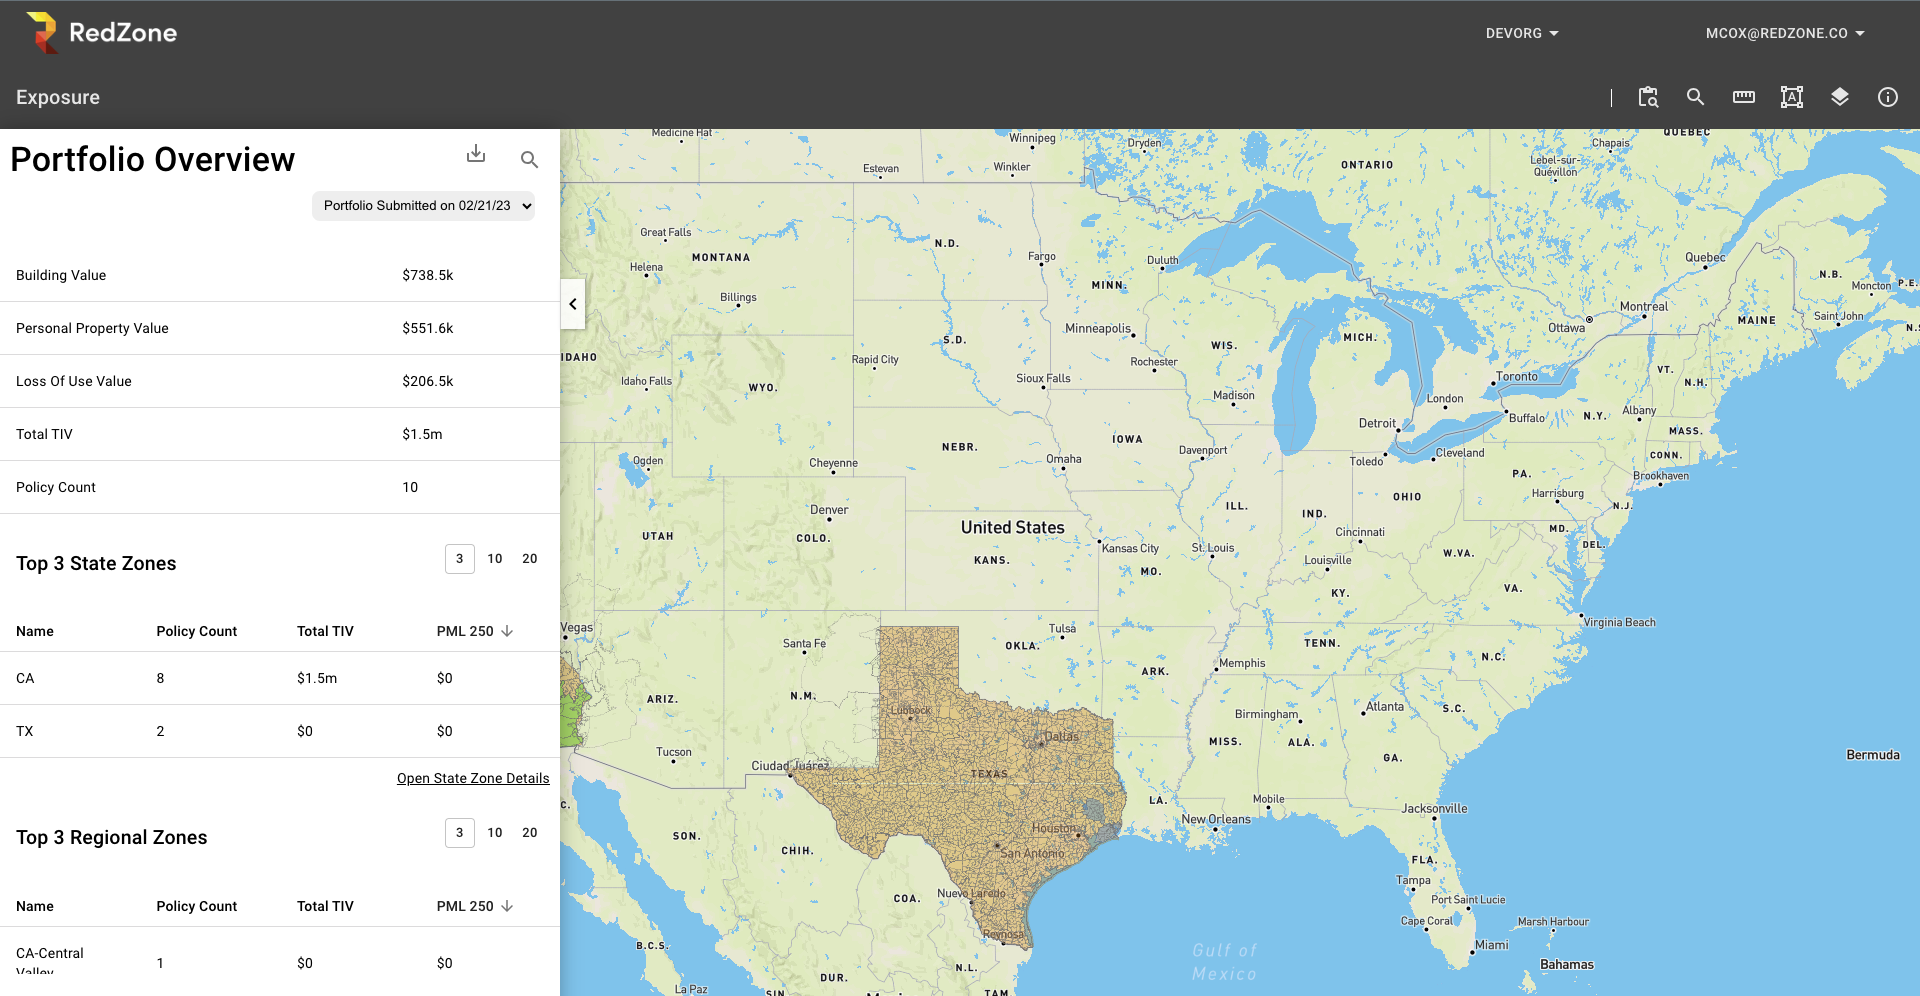
Portfolio Overview Tools


